Profile of the Running ES Score & Positions of GeneSet Members on the Rank Ordered List
| Dataset | Set_03_absentNotch_versus_wtNotch.phenotype_absentNotch_versus_wtNotch.cls #wtNotch_versus_absentNotch |
| Phenotype | phenotype_absentNotch_versus_wtNotch.cls#wtNotch_versus_absentNotch |
| Upregulated in class | absentNotch |
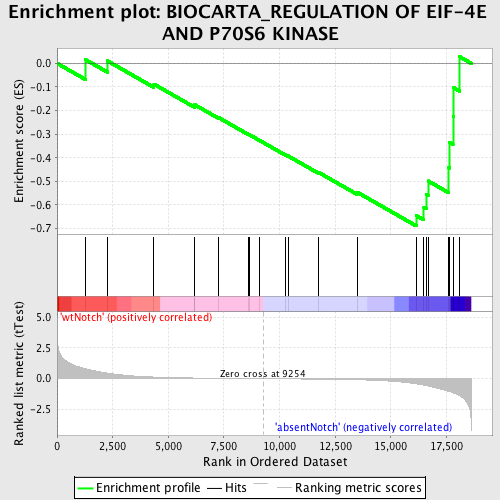
| GeneSet | BIOCARTA_REGULATION OF EIF-4E AND P70S6 KINASE |
| Enrichment Score (ES) | -0.68912375 |
| Normalized Enrichment Score (NES) | -1.5376157 |
| Nominal p-value | 0.018796992 |
| FDR q-value | 0.5984982 |
| FWER p-Value | 1.0 |
| PROBE | DESCRIPTION (from dataset) | GENE SYMBOL | GENE_TITLE | RANK IN GENE LIST | RANK METRIC SCORE | RUNNING ES | CORE ENRICHMENT | |
|---|---|---|---|---|---|---|---|---|
| 1 | MAPK3 | 580161 4780035 | 1279 | 0.803 | 0.0154 | No | ||
| 2 | PRKCA | 6400551 | 2259 | 0.456 | 0.0105 | No | ||
| 3 | PTEN | 3390064 | 4353 | 0.132 | -0.0882 | No | ||
| 4 | PDK2 | 2690017 | 6167 | 0.054 | -0.1800 | No | ||
| 5 | PIK3CA | 6220129 | 6193 | 0.053 | -0.1758 | No | ||
| 6 | IRS1 | 1190204 | 7253 | 0.030 | -0.2296 | No | ||
| 7 | EIF4G1 | 4070446 | 8585 | 0.009 | -0.3002 | No | ||
| 8 | PIK3R1 | 4730671 | 8630 | 0.008 | -0.3017 | No | ||
| 9 | AKT1 | 5290746 | 9115 | 0.002 | -0.3275 | No | ||
| 10 | EIF4EBP1 | 60132 5720148 | 10261 | -0.014 | -0.3876 | No | ||
| 11 | GHR | 2260156 | 10378 | -0.016 | -0.3922 | No | ||
| 12 | FRAP1 | 2850037 6660010 | 11730 | -0.038 | -0.4609 | No | ||
| 13 | RPS6KB1 | 1450427 5080110 6200563 | 13483 | -0.088 | -0.5459 | No | ||
| 14 | MAPK14 | 5290731 | 16148 | -0.418 | -0.6453 | Yes | ||
| 15 | MAPK1 | 3190193 6200253 | 16488 | -0.522 | -0.6089 | Yes | ||
| 16 | PPP2CA | 3990113 | 16603 | -0.562 | -0.5561 | Yes | ||
| 17 | EIF4E | 1580403 70133 6380215 | 16676 | -0.587 | -0.4984 | Yes | ||
| 18 | PSMC4 | 580050 1580025 | 17606 | -1.016 | -0.4419 | Yes | ||
| 19 | MKNK1 | 6510161 | 17640 | -1.030 | -0.3357 | Yes | ||
| 20 | PABPC1 | 2650180 2690253 6020632 1990270 | 17797 | -1.149 | -0.2237 | Yes | ||
| 21 | PDPK1 | 6650168 | 17818 | -1.163 | -0.1029 | Yes | ||
| 22 | EIF4A1 | 1990341 2810300 | 18104 | -1.391 | 0.0275 | Yes |

